Appendix D Sample tool: AST
This Appendix outlines generic instructions for designing and completing an AST based on this format.
Figure 6: SA’s generic AST template
9.1 Designing an AST
- Commence with the generic template in Figure D.1. Consistent use of the same template across options will allow consistency in appraisal within a jurisdiction. However, in some situations, there may be a need to vary the AST template between options.
- Use the top rows to describe the option being appraised, the problem it addresses and whether other options have been considered.
- Column 1 should list the high level strategic objectives for the jurisdiction or transport system, grouped under the triple bottom line (TBL) categories: economic, social and environmental.
- Column 2 should list the impact types relevant to the option. Each impact type should be listed only once, aligned with the most relevant TBL category in Column 1.
In compiling this column, double-counting should be avoided by checking that when a new impact type is added, it does not represent another impact type that is already listed. Defining each impact type (see point 5 below) will greatly assist this process. For example, assume ‘journey time’ is listed as an impact type in Part D of the template provided in Appendix B. Any increases in land values resulting from reduced journey time should not be listed as an impact elsewhere in the AST. The former is a capitalisation of the latter. - Develop (as an attachment to the AST) a description of the meaning of each impact type. Example descriptions of impact types relevant for transport proposals are provided in Table D.1 below.
- In the AST, the list of economic impact types should generally be limited to the direct or primary economic impacts of proposals. Secondary economic impacts, such as economic activity flow-on expenditure effects in the rest of the economy, are generally excluded from the AST. There are two reasons for this:
- Counting flow-on effects is often double-counting the same benefit passed on to other economic agents.
- The Base Case option consists of spending the funds in an alternative manner (either within the same sector or within another sector) that will also generate flow-on effects.
The relevant measure in the AST is the net effect: that is, Project Case minus Base Case. While detailed analysis can be undertaken of the net effect, the rule of thumb is usually to assume the two sets of effects cancel each other out. Detailed analysis to test this is usually only undertaken, as an exception, for very large initiatives or where there are expectations that the net effect will be significant.
9.2 Completing an AST
- Row 1: Insert the name of the proposal.
- Row 2: Clearly describe the challenge being addressed.
- Identify the range of options that can be pursued to address the challenge. Ideally, an AST should be completed for each alternative option, with the full set of tables presented to the decision maker. The AST template presented here is for the preferred option, with a row to list other options considered.
- Row 3: Provide a brief description of the preferred option, denoted here as the ‘Project Case’ or the ‘with project’ case.
- Row 4: Clearly specify the Base Case against which the proposal is being compared. The Base Case is also referred to as the ‘without project’ case. This usually consists of ‘business as usual’: that is, maintaining sufficient expenditure to ensure a continuation of the existing, or minimum, level of service.
- Row 5: Briefly describe the other options for addressing the challenge, and why they are inferior to the preferred option.
- Row 6: This row contains a number of blank boxes. List any key jurisdictional targets to which this initiative makes a significant contribution. List only the most relevant and significant targets.
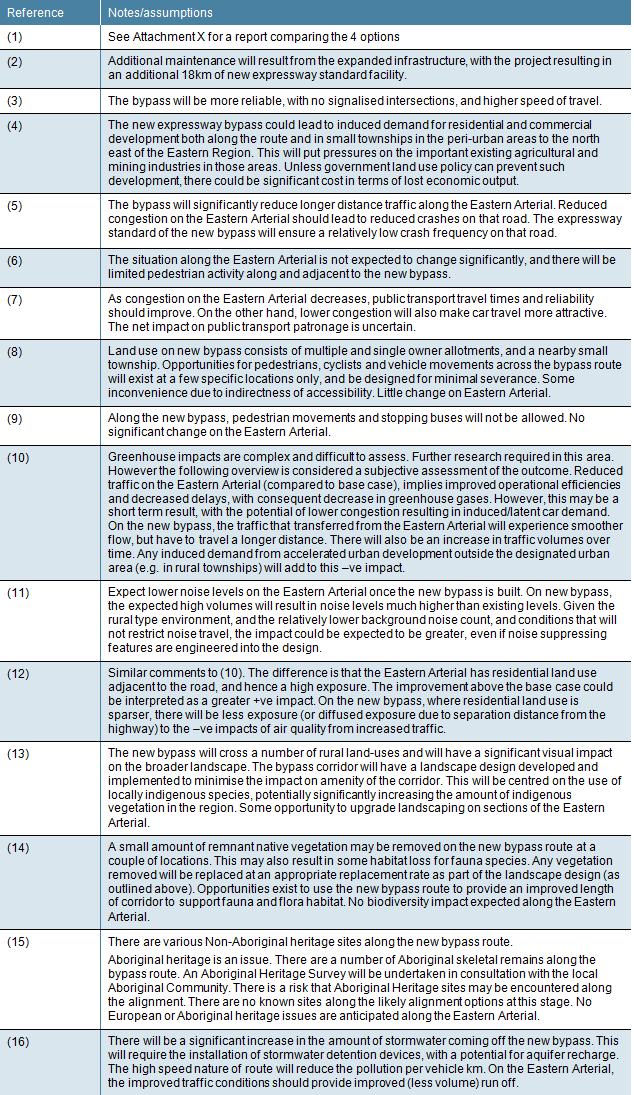
- For each impact type (Column 2), briefly express in Column 3 the impact of the proposal in qualitative terms. Attach to the AST a page of referenced footnotes as required (as illustrated in Table D.3).
- For each impact type, where possible, briefly express in Column 4 the impact in quantitative terms in natural units. For example:
- For greenhouse gas emissions, natural units are tonnes of CO2.
- For safety, natural units are reductions in accidents, lives saved, injuries avoided, etc.
- Decide which impacts can be monetised and those that can only be expressed in non- monetised terms.
- For each impact type, make an assessment in Column 5 of the size or scale of the impact using the following approaches:
-
Monetised impacts: Determine the present value (PV) of each impact over the appraisal period. The PV of impacts that are benefits should be denoted by PVB $x million (present value benefits). The PV of impacts that are costs should be denoted by PVC $y million (present value costs). The sum of all PVBs and the sum of all PVCs should be recorded in the bottom row of the AST, along with standard CBA results (such as NPV and BCR).
Where a specific computer model has been used to determine monetised discounted results for benefits and costs, the name of the model should be stated, and details of the model made available. - Non-monetised impacts: Each non-monetised impact should be assigned a ‘rating’ level between Large –ve to Large +ve from the scale provided in Figure C.2 of Appendix C. The UK Department for Transport (2006, Unit 1.1) provides detailed guidance for selecting a rating for a large number of impact types. Detailed guidance does not exist in Australian jurisdictions.
-
Monetised impacts: Determine the present value (PV) of each impact over the appraisal period. The PV of impacts that are benefits should be denoted by PVB $x million (present value benefits). The PV of impacts that are costs should be denoted by PVC $y million (present value costs). The sum of all PVBs and the sum of all PVCs should be recorded in the bottom row of the AST, along with standard CBA results (such as NPV and BCR).
If the UK reference is used, relevance to Australian conditions should be carefully assessed.
- For each assessment rating in Column 5, assign a ‘confidence’ level rating in Column 6 (see Table D.2).
| IMPACT TYPE | DESCRIPTION |
|---|---|
| Capital cost | Up-front investment, plus any non-recurrent expenditure elsewhere in the evaluation period. |
| Infrastructure maintenance costs | Effect on infrastructure maintenance costs. |
| Infrastructure operating costs | Effect on infrastructure operating costs. |
| Journey time | Effect on time involved in transport: walk (access) time, wait time at public transport stops, in-vehicle time. |
| Reliability/quality | Effect on service reliability, journey time variability and journey quality (e.g. comfort). |
| Vehicle/bus/train/etc operating costs | Effect on vehicle/bus/train/etc. operating costs: fuel, tyre wear, lubricants, repairs and maintenance, etc. |
| Regeneration | Extent to which the initiative assists regeneration of areas the government has designated for regeneration. |
| Public security | Effect on the number and severity of crashes/accidents and the impact on people, including deaths, serious injuries, minor injuries, property damage. |
| Access to public transport | The extent the initiative increases the number of people or locations that fall within minimum standards for access to public transport, e.g. within 500 metres of a public transport stop. Any improvements in journey quality should be captured under the reliability/quality impact category above. |
| Severance | The degree to which infrastructure and transport services act as a physical barrier to non-users of these facilities to access people and services elsewhere in the community. |
| Mobility impaired | Extent to which access to public transport is improved for people who are mobility impaired. |
| Passengers and cyclists | Extent to which the initiative impacts on pedestrians and cyclists. |
| Greenhouse | Effect on greenhouse gas emissions and the impact on society. |
| Noise | Effect on noise and the impact on the community. |
| Local air quality | Effect of various emissions on local air quality. |
| Biodiversity | Effect on biodiversity |
| Heritage | Effect on local heritage - buildings and other items with heritage value. |
| Water | Effect on level of water pollution and the impacts. |
| CONFIDENCE LEVEL | DESCRIPTION |
|---|---|
| Very Low (VL) | Best guess of professional assessing outside area of expertise, gut feel, no relevant studies or data. Not suitable basis for ‘rating’ greater than ‘slight +ve’ or less than ‘slight –ve’. |
| Low (L) | Professional judgment within area of expertise. However, no relevant studies or data available. Not suitable for score greater than ‘slight +ve’ or less than ‘slight –ve’. |
| Medium (M) | Some background information, but either dated, lacking appropriate detail or lacking accuracy to form the basis for a firm assessment. Not suitable for a score greater than ‘moderate +ve’ or less than ‘moderate –ve’. |
| High (H) | Substantial information, perhaps patchy in parts (date, accuracy, detail) but sufficient to provide an accurate assessment with a fair degree of confidence. |
| Very High (VH) | Recent, relevant and accurate studies with appropriate detail and analysis to form a rigorous and defensible basis for the assessment. Assessment has a very high degree of confidence |
Source: NGTSM06, Volume 2
9.3 AST examples
Figure D.2 provides a completed AST for a generic road transport example and Table D.3 shows the accompanying footnotes.
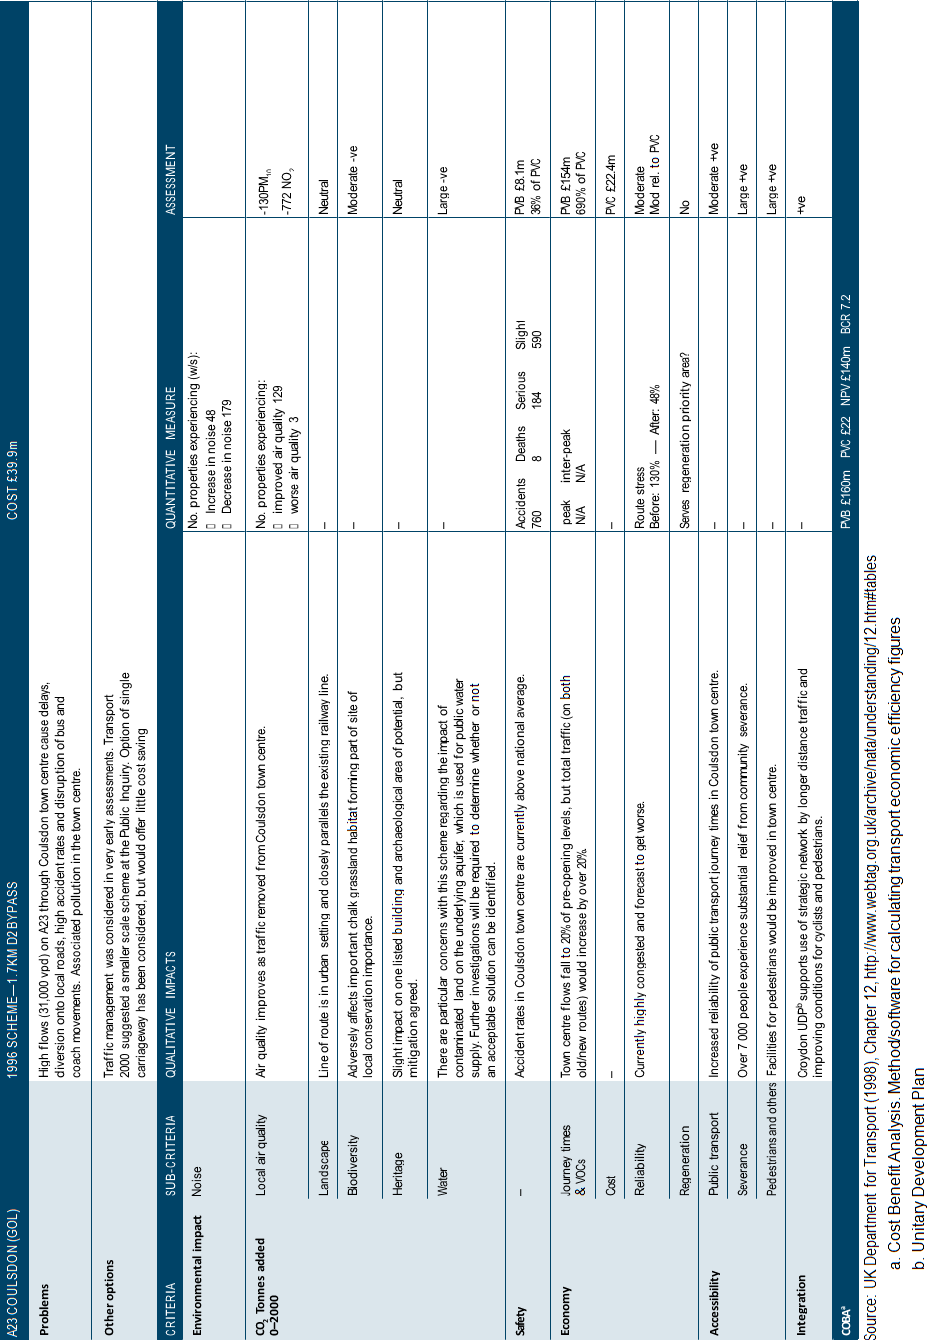
Figure D.3 provides a UK example of a completed AST.
Figure 7: AST - road transport example
Figure 8: AST- road transport example - footnotes
Figure 9: AST - UK example


